
ETDRS (LogMAR) Vision Test Charts
ETDRS is a type of visual acuity test that is standardized and represents a significant improvement over previous visual acuity testing methods, such as the Snellen and Sloan Tests.
Background on ETDRS
The ETDRS test, short for Early Treatment Diabetic Retinopathy Study, was developed to aid in evaluating the changes in vision following treatment for patients with diabetic retinopathy. Prior to the study, treatment results were somewhat confusing due to inadequacies of the acuity tests. One drawback for the commonly used tests, e.g., Snellen Acuity, is that it presents a different number of letters per row, for example 10 letters on the 20/20 line, but only 3 letters on the 20/70 line. Therefore, if the results of a study showed that the patients “gained three letters of acuity,” the results could indicate the gain of a full acuity line, as in the 20/70 line, or only a portion of an acuity line, as in the 20/20 line. Also, the percentage difference between individual lines on the Snellen acuity varies from line to line. For example, the change from the 20/25 line to the 20/20 line is 20%, while the change from the 20/30 line to the 20/25 line is 16%. Again, referring back to the diabetic studies, if a study demonstrated a two-line increase in acuity, it could mean a 33% improvement from 20/30 to 20/20, or a 40% improvement from 20/50 to 20/30. These inadequacies of the Snellen acuity test made it impossible to properly apply statistics to evaluate the acuity data and to compare data from study to study.
Other inadequacies also exist in the Snellen Acuity test. These include the types of letters used on the test and the spacing of the letters.
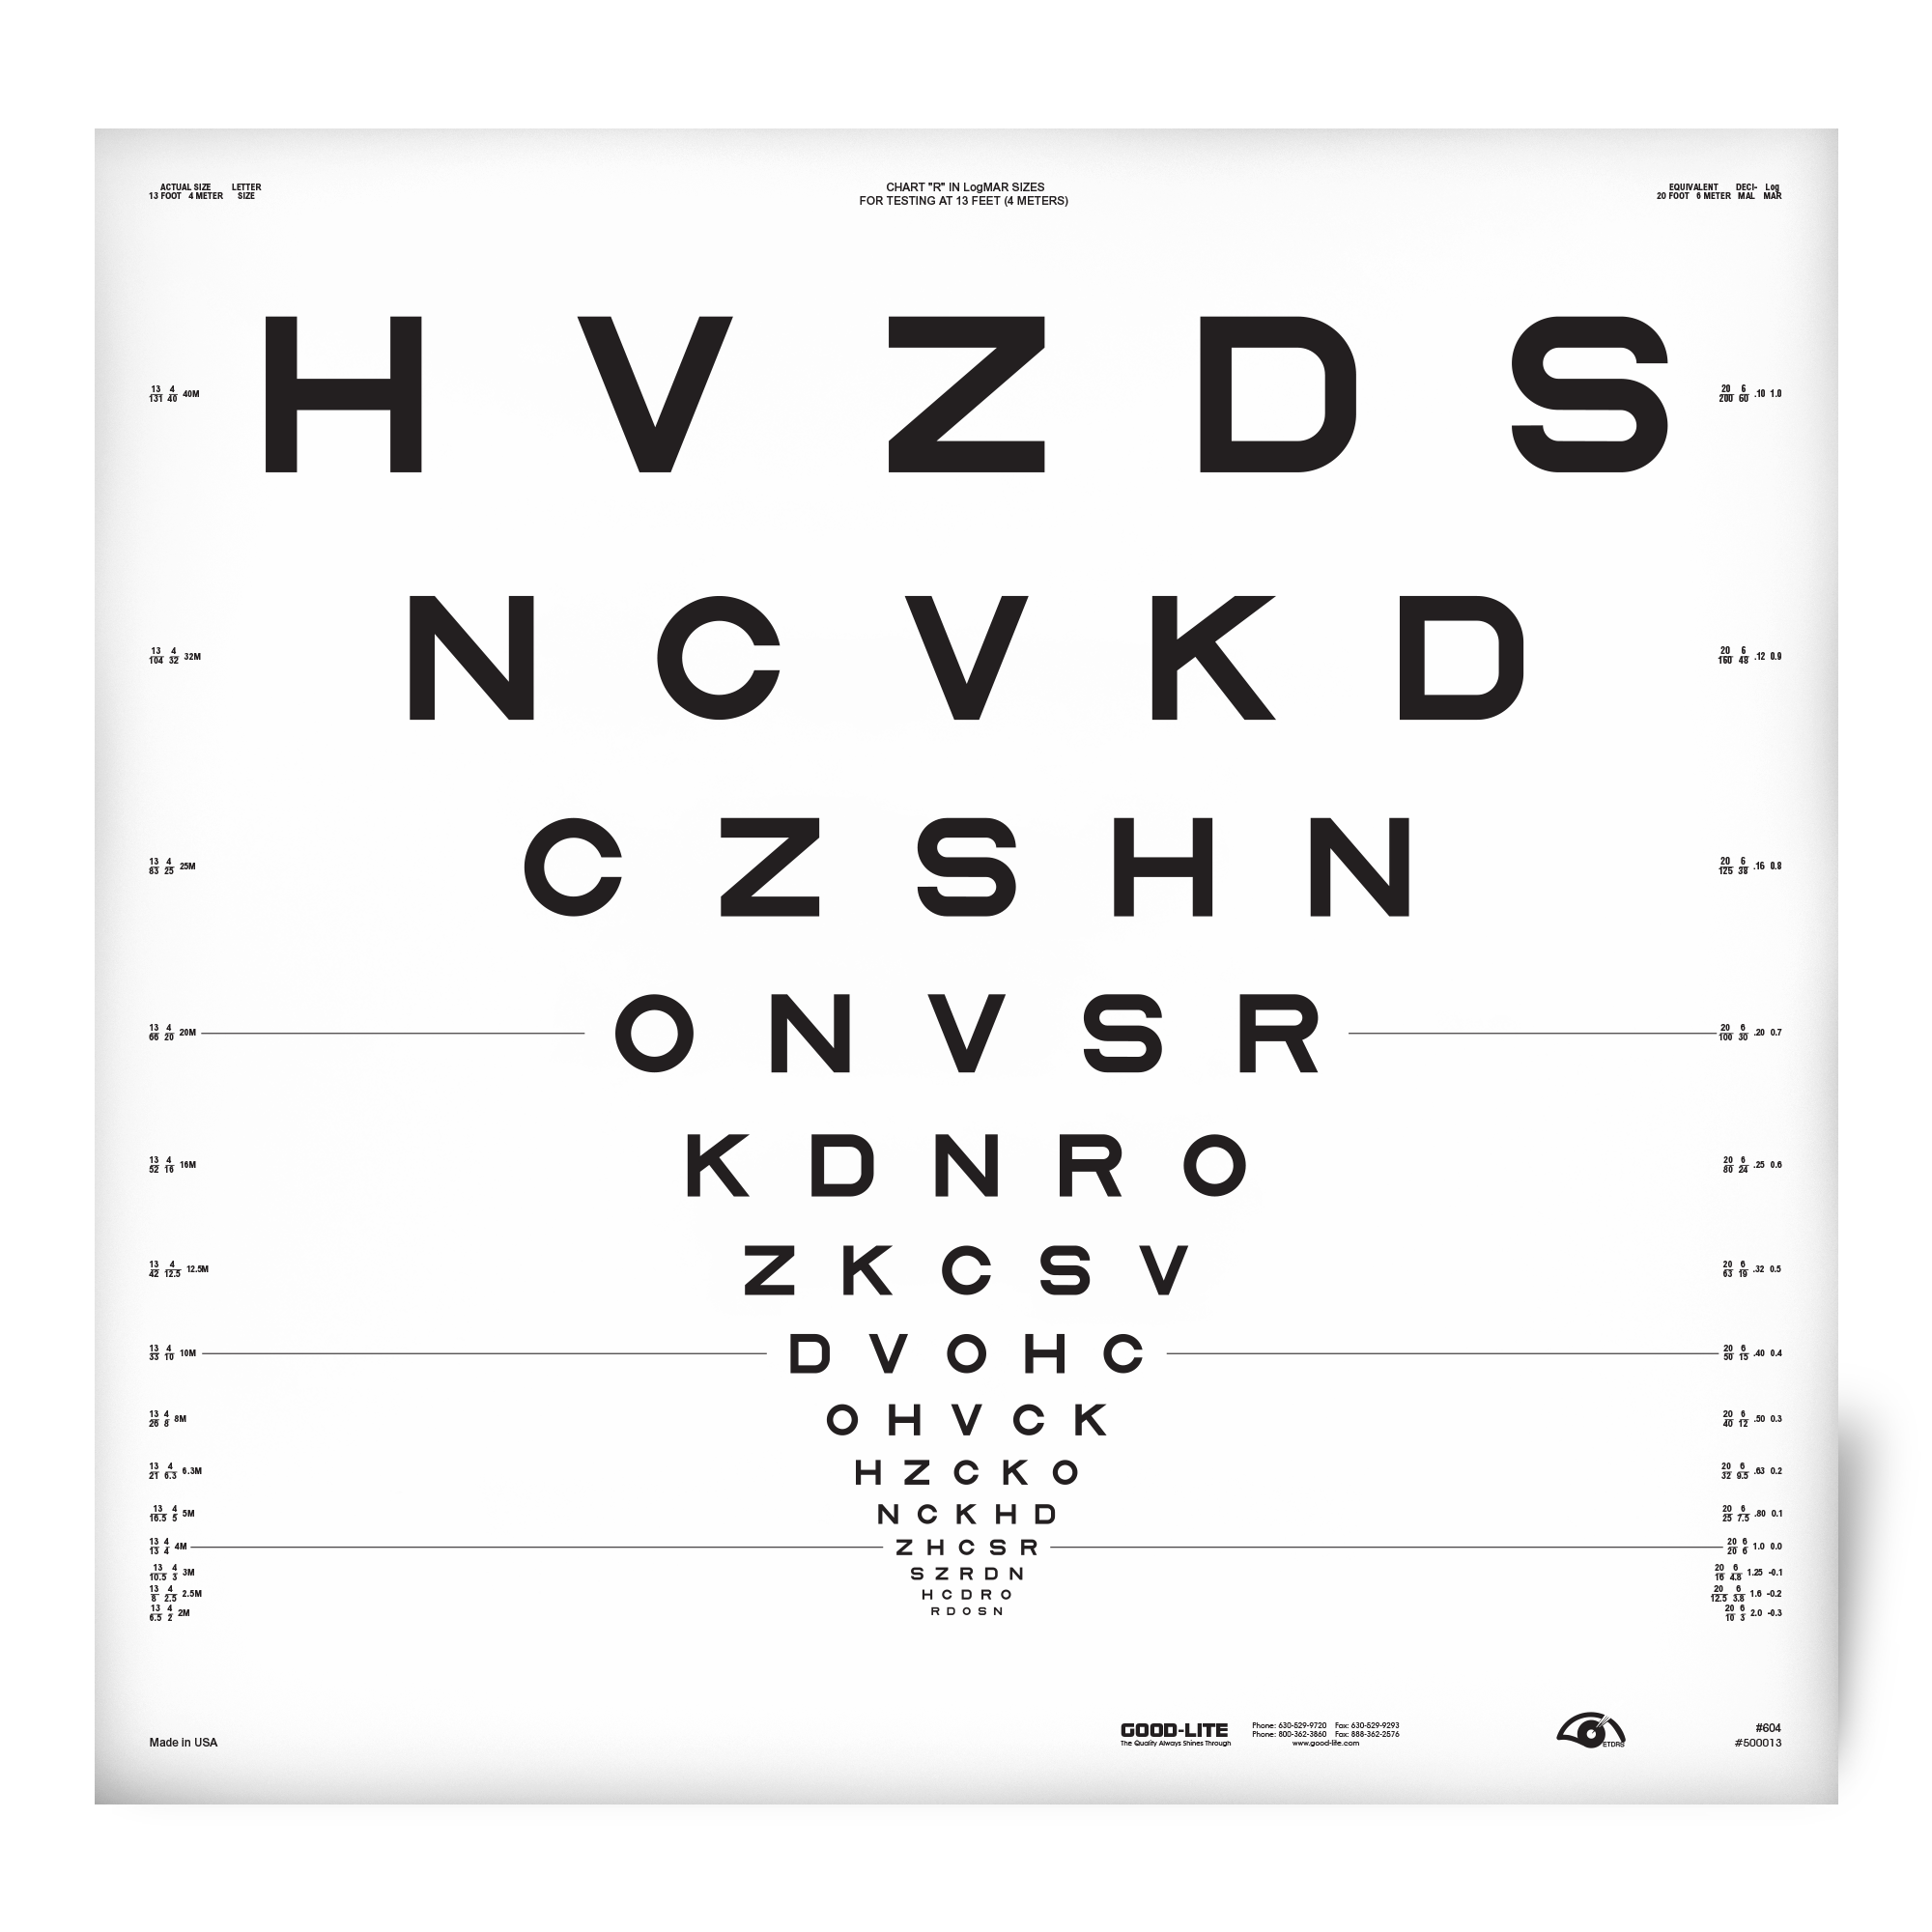
ETDRS Design
The ETDRS test incorporates specific design criteria to make it more accurate than the Snellen or Sloan acuity tests. These include:
- Same number of letters per row (five letters per row)
- Equal spacing of the rows on a log scale (the rows are separated by 0.1. log unit)
- Equal spacing of the letters on a log scale
- Individual rows balanced for letter difficulty
To prevent memorization, different versions of the ETDRS test chart are available. The three standard versions of the ETDRS chart are R, 1 and 2.
ETDRS Standardization
To properly evaluate ETDRS, the test should be conducted under standardized lighting conditions. Good-Lite provides a range of ETDRS charts and well back-lit ETDRS tests for both near and distance acuity. For the back-lit tests, the test lighting is calibrated to the recommended photopic test level of 85 cd/m2. This light level has been recommended by the National Academy of Sciences and by the American National Standards Institute for ETDRS and contrast sensitivity vision testing. It is also the level of testing luminance required in FDA clinical trials.
LogMAR Testing
ETDRS tests are also known as LogMAR tests. This designation derives from the fact that the spacing of the letters and of the rows are equal on a logarithmic scale (Log scale). The rows are separated by 0.1 Log unit, and each letter has a value of 0.02 Log unit.
Scoring the ETDRS Acuity Results
The two most common methods for scoring the ETDRS test results are described below. Both of these methods provide scores that can be used for statistical analysis, unlike the scores provided by the Snellen or Sloan Acuity tests.
ETDRS Scoring Method – Number of Letters
The patient starts at the top of the chart and reads down until he or she reaches a row where a minimum of three letters on a line cannot be read. The patient is scored by how many letters could be correctly identified.
ETDRS Scoring Method - LogMAR
The ETDRS charts were originally used in ETDRS studies where patients had relatively poor vision. For these studies, starting patients at the top of the chart to read down worked well since most patients could read only about halfway down the chart and the test was relatively quick. However, the ETDRS charts are now being widely used for many studies, including IOL and refractive surgery studies, where patients have relatively good visual acuity. For these patients, starting at the top of the test makes the testing time much longer, so a second scoring method is used. The patient starts on the last row where he or she can read all 5 of the letters, and then reads down until he or she reaches a row where a minimum of three letters cannot be read. For these patients, a decimal ETDRS acuity score can be determined. To calculate the decimal acuity score, review the example below.
Determine the last row where the patient can correctly identify all 5 letters on that row and then:
- Determine the log score for that row (these scores are shown in the margin of the ETDRS test, e.g., the 20/25 line has a log score of 0.1)
- Subtract 0.02 log units for every letter that is correctly identified beyond the last row where all of the letters are correctly identified. For example, if the patient reads all of the letters correctly on the 20/32 row and then 3 letters correctly on the 20/25 row, the Log Score would be calculated as follows:
20/32 Row = 0.20
3 letters X 0.02 log/letter = – 0.06
ETDRS Acuity Log Score: 0.2 – 0.06 = 0.14
